CLO Equity: A Primer for Investors

Dan Sherry, CFA
Portfolio Manager, US CLO Management
Collateralized loan obligation (CLO) equity has emerged as a source of potentially robust, and front-loaded, returns for sophisticated investors.
While the interest rate environment can influence demand for the asset class, even seasoned investors may underestimate the optionality inherent to CLOs – which enables managers to respond to changing market and economic conditions to potentially generate persistent equity distributions.
Because equity investors sit below all debt tranches in terms of seniority, they are the first to absorb losses if any of the underlying loans default – a key risk. However, because they have a claim on profits, equity holders are positioned to capture the upside when a transaction outperforms.
Identifying CLO management styles that are consistent over time allows for the development of a portfolio of CLO equity exposures diversified across vintages. This can help deliver attractive risk-adjusted returns and further manage risk.

Over the past 35 years, collateralized loan obligations (CLOs) have grown from a niche asset class into a $1.1 trillion pillar of the corporate financing markets, with US BSL CLOs representing about 68% of demand for US corporate loans today.1 The variable-rate CLO debt securities issued on the backs of these loans have become a mainstay of institutional portfolios, given their dependable, and frequently attractive, yields.
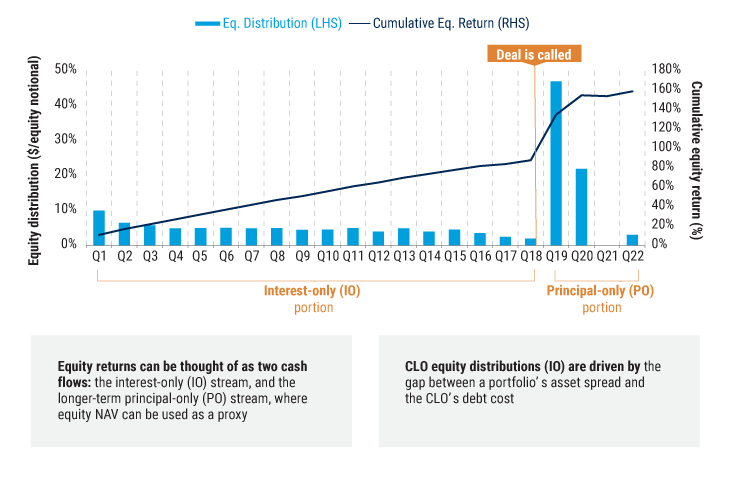
Yet CLOs offer another attractive option for investors: their equity tranches, which capture the difference between what a CLO earns in loan interest and what it owes the CLO debtholders. For a certain group of discerning investors, this is the most interesting part of a CLO – a hybrid investment combining the prospective double-digit returns of private equity with a quarterly distributed front-loaded cash flow more akin to bonds.
Changes in CLO debt costs, which can squeeze or bolster the net spread available to CLO equity investors, can cause ebbs and flows in appetite for the asset class. However, as a tenured CLO manager we have learned that CLO equity returns often unfold in ways that may defy investors’ expectations.
Part of this phenomenon is simply a function of the lifespan of the average CLO investment. A typical newly issued CLO lasts a minimum of five years and often extends a year or two more for the CLO to amortize and redeem. A lot can change in five to seven years.
Moreover, CLO managers have a robust toolkit for gearing their returns to broad changes in the market and economic environment. CLOs provide considerable optionality through both their inherent structural features and the potential for trading decisions within the portfolio.
Recent vintages provide a good example of how CLO equity returns may exceed expectations. Among CLO managers and investors, the second half of 2022 was widely regarded as an unattractive time to issue a CLO. As the Federal Reserve accelerated its rate hikes, loan prices plummeted, CLO debt costs soared, and CLO issuance volumes fell significantly. As it turned out, however, many CLO managers who issued CLOs during that time were able to purchase loan portfolios at attractive prices – even though CLO debt costs remained high relative to historical levels. This has allowed them to generate very attractive returns for their equity investors to date.2 The same pattern was present for much of 2023. In contrast, during 2024, CLO debt costs declined while loan prices rose, which should lead to better current equity distributions but more limited upside to the principal value of portfolios ramped during this period. While the drivers of CLO equity returns can change over time, we believe the long-term benefits of CLO equity are still firmly in place.
To more fully understand why CLO equity can often transcend broader conditions, a look at the underlying mechanics of the asset class may be helpful.
How CLO equity works
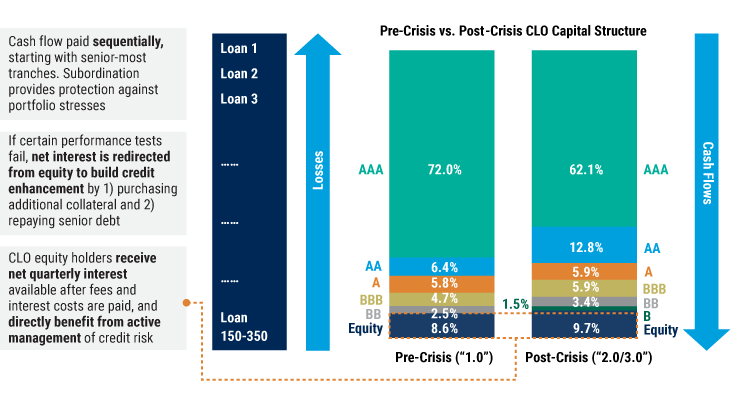
An easy way to think of the CLO vehicle is as a kind of company in itself: a company in the business of purchasing leveraged loans. A CLO raises funds that it uses to purchase a pool of roughly 150 to 350 leveraged loans, which serve as the company’s “assets” or “collateral.” The loans are floating rate and pay interest monthly or quarterly based on a spread above an index (typically SOFR). On the other side of its balance sheet, the CLO has both debt and equity investors. CLO debt, which has multiple tranches with varying levels of seniority, also pays a floating rate based on an index (SOFR in the US and Euribor in Europe) plus a spread; the CLO equity has a claim on profits. In a typical CLO funding stack, the debt/equity split is approximately 90%/10%.
The cash flow from a CLO runs through a quarterly payment waterfall. After the CLO pays expenses and the interest owed on the CLO debt, the remaining net spread is paid as a distribution to the equity investors. Because the equity investors sit below all debt tranches in terms of seniority, they are the first to absorb losses if any of the underlying loans default. However, CLO equity is also the best positioned tranche within a CLO structure to capture upside value under favorable conditions, as we explain further below.
Figure 1: How CLOs Are Structured
CLOs include several tranches of interest-paying bonds, along with an equity tranche, which captures the net spread and residual principal value generated by active management.

Sources: Citibank as of 30 September 2021. “Crisis” refers to global financial crisis. Pre-crisis CLO source: Pitchbook LCD, Moody’s, Creditflux, Intex, Wells Fargo Securities, LLC as of 31 July 2019. Post-crisis CLO source: Pitchbook LCD, Intex, Barclays Research as of 22 January 2021. Note: All data is median of Q4 2020 vintage deals, thus tranche thickness does not add up to 100%. Any views represent the opinion of the manager and are subject to change. Diversification does not ensure against loss. For illustrative purposes only.
Figure 2: What Drives CLO Equity Returns

Source: Barclays Research. For illustrative purposes only. We are not soliciting or recommending any action based on this material. Any views represent the opinion of the investment manager and are subject to change.
CLO structure: misconceptions and sources of risk mitigation
One of the misconceptions about CLOs is that because their underlying collateral is below-investment-grade, they carry a high level of default risk. In fact, these are diverse pools of senior secured loans from large companies with robust reporting and long track records of on-time payment. As the table below shows, since 1996, no AAA tranche has ever defaulted, and defaults have been minimal for most other tranches as well.
In addition to the diversity and strong credit performance of their underlying loans, the CLO terms themselves provide further investor protections. CLO managers must regularly test the soundness of their funds to ensure that the income generated will adequately cover the amount owed on the liabilities and that there is enough “overcollateralization” to absorb even a stressed scenario of defaults. CLOs held up well during the financial crisis. Even so, broad-based financial reforms introduced since have raised the standards even higher.
Although it does not happen often, equity investors can be directly impacted by these various safeguards. If a test “fails,” capital is immediately diverted to bring the interest coverage and subordination levels back into compliance – starting at the bottom of the waterfall with the proceeds that would otherwise go to the equity investors – by reinvesting in additional loan collateral or retiring some of the CLO debt.
Figure 3: CLO Defaults Have Been Few and Far Between
S&P US CLO tranche and US corporate default history (as of 31 December 2023)

Sources: CLO default data: S&P Global Ratings Credit Research & Insights and S&P Global Market Intelligence’s CreditPro, “Default, Transition, and Recovery: 2023 Annual Global Leveraged Loan CLO Default And Rating Transition Study,” as of 27 June 2024. US corporates default data: S&P Global Ratings Credit Research & Insights and S&P Global Market Intelligence’s CreditPro, “Default, Transition, and Recovery: 2023 Annual Global Corporate Default And Rating Transition Study,” as of 28 March 2024.
How active management can create value
While CLOs have terms that protect the overall structure in stress scenarios, they also have gears to capture value when opportunities arise.
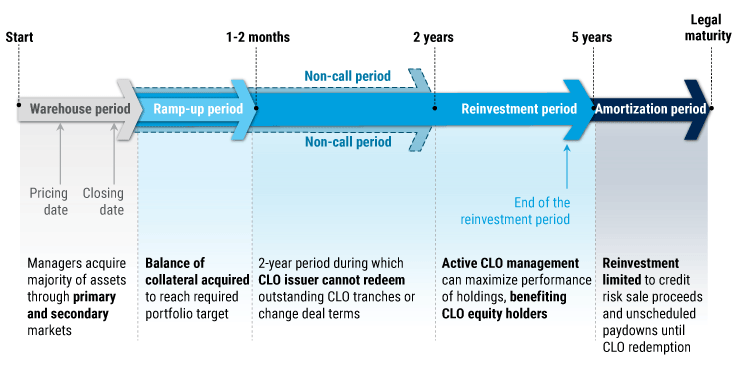
After a CLO has ramped up, it enters a four- to five-year period during which the manager is free to sell existing holdings and buy new loans. During this “reinvestment” period, the most effective active CLO managers continually monitor their holdings and the markets for opportunities to upgrade. For the equity holders, these opportunities to “par build,” as the process is known, can be especially remunerative.
Let’s say a manager, based on its own credit research, comes across a loan facility at least as high-quality, if not higher, than many of its existing par-value holdings, but selling at a market price of 98 – a 2% discount to par. Two percent may not sound like a lot. However, the equity position’s capital is levered 10 to 1. So, if a loan purchased at 98 is eventually sold or repaid at par, that benefits the CLO equity’s principal value by 20%. The challenge for CLO managers is to find these types of opportunities while simultaneously managing credit risk on a consistent basis throughout a credit cycle.
Figure 4: The CLO Lifecycle – Active Management During the Reinvestment Period Can Maximize Performance Potential

For illustrative purposes only. We are not soliciting or recommending any action based on this material.
Optionality is driven by potential CLO structural changes
Beyond active management, potential structural changes also offer opportunities to capture value. For instance, during the reinvestment period, if a majority of the CLO equity holders (whether the largest investor or a caucus) chooses, it can direct, or accede to, the manager’s decision to “call” the liabilities and refinance the CLO’s debt. This is analogous to a homeowner refinancing a fixed-rate mortgage when interest rates decline. While the index rate owed the debt investors floats (as does the index rate earned by the assets), the credit spread on top of it doesn’t. So, if the spread owed the debt investors narrows, a refinancing can lock in lower liability costs, and thus higher profits, for the remaining life of the fund.
In addition to a straight refinancing, if market conditions permit, the CLO equity majority has another option: a “reset,” through which all of the CLO debt is refinanced and the CLO is given a new reinvestment period and legal maturity, among other changes. A reset can enhance and extend the CLO equity return profile, all without sourcing a new pool of starting loans.
Why CLO equity can rise above the macro environment
Another misconception about CLO equity is that its best days may have passed, spanning the decade of low rates following the global financial crisis and ending with the sharp post-pandemic hikes. There were indeed many years during that period when, using the various mechanisms at their disposal, CLO managers produced attractive yields and internal rates of return (IRRs) for their debt and equity investors alike. What can be overlooked, though, is that CLO equity can perform well in different environments and that the best periods for CLO equity to date have tended to be vintages launched on the eve of periods of increased risk, such as 2007, and perhaps not at times one would expect to produce strong returns.
The reason is simple: Many of the CLOs created in 2007 were early in their reinvestment periods in the first half of 2008, when Bear Stearns collapsed and corporate credit spreads blew out. CLO managers suddenly had their pick of leveraged loans trading substantially below par.3 The discounts at which they were able to acquire the loans added significantly to par build, and when managers’ own analysis of the intrinsic soundness of the loans proved correct, the associated increase in profit margins stuck for the life of the funds.
A similar pattern was seen with the early-2020 vintage, as spreads widened with the severe market dislocations early in the pandemic. Conversely, performance for the 2021 vintage, a popular year for new issuances, has proved to be middling when considered against the equity distributions and changes in underlying net asset value (NAV) of other recent vintages. The 2022 and 2023 vintages, which had a more uncertain return profile at the time of issuance, have to date performed better than the 2021 vintage. It’s still early, but the 2024 vintage is more likely to look like the 2021 vintage, characterized by strong CLO issuance, declining CLO debt costs, and higher loan prices. In each case, weaker (or stronger) starting market sentiment lowered (or raised) the bar for subsequent NAV gains.4
Essentially, the optionality embedded in CLO equity makes it highly adaptable to shifts in the economic environment.
All else equal, falling rates would tend to be worse for CLO equity than rising rates. Falling rates lower the floating base rate generated by a CLO’s assets. They also lower the base rate interest owed on the CLO debt. However, because a typical CLO effectively has 10% more assets than liabilities (with 10% of the capital as equity), lower rates reduce inflows from interest earned on the underlying loan assets more than they do the interest owed to CLO debt investors, reducing the cash available for equity distributions.
That said, when it comes to CLO equity, all else is almost never equal. After all, if rates are coming down, this could mean the economy has started to slow and the Fed has stepped in to lower financing costs for consumers and businesses. More companies may be struggling to pay their debts, and more struggling companies means wider spreads – and therefore more opportunities for par build. On the other hand, rates could be dropping because inflation is moderating and the economy is strong, resulting in tighter loan spreads. However, a period of tighter loan spreads would likely coincide with lower CLO debt costs and tee up the potential for a CLO refinancing or reset.
While a period of stable prices and spreads for CLO assets and liabilities can result in good equity outcomes, a stable market environment is unlikely to persist for the duration of a CLO’s expected life. In general, a change in market risk and therefore expected returns will provide opportunities to enhance returns for CLO equity investors. These opportunities could stem from the ability to lock in low, attractive CLO debt costs, a period of loan price volatility and widening spreads, or a combination of these types of environments within the lifespan of a CLO. Together, different market environments can provide disciplined CLO managers a foundation from which to drive outsized equity returns.
Key benefits of CLO equity investments
While it’s hard to know ahead of time which CLO vintages will outperform or underperform, a number of scenarios in the coming years should give CLO managers ample opportunities to create significant value for their equity investors. The case for CLO equity remains intact, and we think that case boils down to three arguments:
1. An attractive (and attractively time-weighted) return profile
CLO equity historically has typically provided double-digit annual distributions5 paid quarterly, resulting in a short expected weighted average life (WAL) relative to other asset classes with similar return profiles (such as private equity).6 While the source of CLO equity return can shift, and frequently does – at times driven by current distributions, at others by principal upside from purchasing loans below par – we believe CLO equity investments exhibit return characteristics that can benefit the portfolios of almost any sophisticated investor.
2. Low correlation and term financing
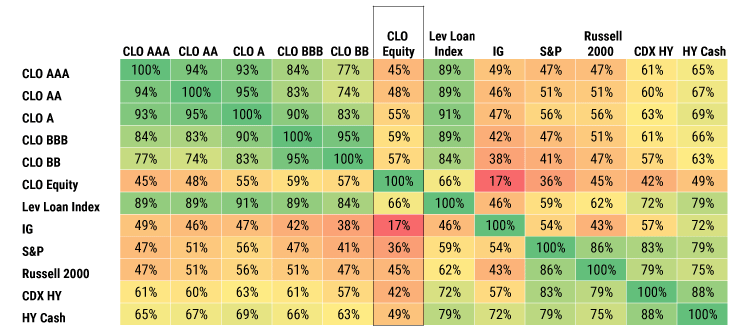
In addition to a time-weighted profile that complements other asset classes, CLO equity cash flows themselves exhibit low correlation with other risk assets. As the table below shows, even the correlation with high yield bonds, which could be viewed as an adjacent asset class, has been below 50% since January 2013.
During periods of market disruption, such as the onset of Covid, negative changes in the NAV of underlying CLO loan collateral can become amplified. However, as long as a CLO meets the performance criteria in its indenture, the equity cash flows are unaffected. Interest generation from underlying CLO loan portfolios is not directly affected by price volatility in financial markets. CLOs do not become forced sellers of stressed assets during market downturns because CLO debt investors have little ability to call the debt tranches (absent the triggering of certain extreme “event of default” clauses under CLO indentures).
Figure 5: CLO Equity Exhibits Low Correlation Relative to Other Risk Assets
Cross-asset-class correlations: January 2013-December 2024

Source: Citigroup Global Markets Inc., “Cross asset total return correlation” as of 31 December 2024. Asset correlations are calculated for the period January 2013 to December 2024.
3. Direct benefits from active management of credit risk
A key driver of CLO equity performance is the manager’s ability to actively manage credit risk and navigate the portfolio through different market conditions. A skilled manager can react to and leverage a number of factors to drive CLO equity returns, including movement in loan and CLO debt credit spreads, credit losses, net trading activities, and changes in interest rates, among others. Unlike with some other asset classes, the more market conditions fluctuate, the more opportunities arise for experienced managers to optimize returns.
Investing successfully in CLO equity
To maximize the benefits from investing in CLO equity, investors must consider a number of factors. And given the high degree of variability in this asset class, we believe manager selection is paramount. Key criteria to consider include a manager’s level of experience, its debt versus equity performance, and its communication and collaboration with investors. But perhaps most important is a clearly articulated approach and consistent performance demonstrated through business cycles.
A broad range of manager styles may appeal to CLO equity investors, from more aggressive strategies that seek to maximize current interest and par build, to those that place greater emphasis on balancing such aims with limiting credit losses, tail risk, and maintaining strong principal values over time. So, selecting wisely can also help fine-tune outcomes to an investor’s desired risk-return profile.
With constancy as their guide, investors can then think about putting together a portfolio of CLO equity exposures, whether from one manager or a select handful of managers with exposure across different vintages. A strong suit of CLO equity is its adaptability to different economic and rate environments. That said, a portfolio approach implemented over time may allow an investor to access more of the banner years while limiting exposure to the risk of prolonged market turmoil and higher-than-expected defaults, or of stubbornly compressed spreads that squeeze cash available for equity distributions. Other investors may choose to invest in a pre-selected CLO equity fund (whether from the same or a small group of highly rated managers) for many of the same reasons.
All told, we believe CLO equity can provide significant benefits to various institutional and sophisticated private banking investors, driven by a double-digit historical return profile along with high current income, generally persistent cash flows (even during periods of financial market volatility), and active management to limit downside risk and capture upside opportunities.7
Identifying CLO management styles that have been consistent over time allows for development of a portfolio approach that seeks to manage risk while delivering attractive risk-adjusted returns.
PineBridge has a long history in CLOs
PineBridge Investments has extensive experience in CLOs, with a distinct vantage point both as an investor in third-party CLOs and as a CLO issuer.
Since 1999, we’ve issued 40 CLOs in the US and Europe, with a par value of approximately $16.5 billion. In addition, we’ve reissued, reset, or refinanced 26 transactions worth $11.9 billion.8
Our stable and tenured leveraged finance team includes:9
Portfolio managers averaging 27 years of industry experience and 18 years at the firm
A deep bench of credit analysts, averaging 19 years of industry experience and 10 years at the firm
In fixed income, our experience extends across the spectrum of developed and emerging markets, investment grade debt, leveraged finance, private credit, and multi-sector strategies.
Our investment process is informed by integrated, proprietary global credit research and rigorous credit analysis across the capital stack, sectors, and regions.
Our leveraged finance portfolios total $27.4 billion, including $6.7 billion in US and European CLOs and $4.2 billion in CLO tranches.10
1 Sources: BofA Global Research, Intex, LCD as of 31 January 2025. The $1.1 trillion US CLO market comprises $955 billion of US BSL CLOs and $132 billion of US Middle Market CLOs.
2 Source: BofA Global Research, “CLO Equity Data” as of 18 January 2024.
3 Source: BofA Global Research, “CLO Equity Data” as of 18 January 2024.
4 Source: BofA Global Research, “CLO Equity Data” as of 18 January 2024.
5 Source: BofA Global Research, “CLO Equity Data” as of 18 January 2024.
6 Past performance is not indicative of future results.
7 No investment strategy or risk management technique can guarantee returns or eliminate risk in any market environment.
8 As of 31 December 2024. Includes all CLOs managed by PineBridge (or an affiliate).
9 As of 31 December 2024.
10 As of 31 December 2024. Includes all leveraged finance portfolios managed by PineBridge (or an affiliate).
Disclosure
Investing involves risk, including possible loss of principal. The information presented herein is for illustrative purposes only and should not be considered reflective of any particular security, strategy, or investment product. It represents a general assessment of the markets at a specific time and is not a guarantee of future performance results or market movement. This material does not constitute investment, financial, legal, tax, or other advice; investment research or a product of any research department; an offer to sell, or the solicitation of an offer to purchase any security or interest in a fund; or a recommendation for any investment product or strategy. PineBridge Investments is not soliciting or recommending any action based on information in this document. Any opinions, projections, or forward-looking statements expressed herein are solely those of the author, may differ from the views or opinions expressed by other areas of PineBridge Investments, and are only for general informational purposes as of the date indicated. Views may be based on third-party data that has not been independently verified. PineBridge Investments does not approve of or endorse any republication of this material. You are solely responsible for deciding whether any investment product or strategy is appropriate for you based upon your investment goals, financial situation and tolerance for risk.


