They’re Called High Yield Bonds, Not High Spread Bonds. And They’re Having a Moment.

John Yovanovic, CFA
Co-Head of Leveraged Finance

Andrew Karlsberg, CFA
Portfolio Risk Manager and Investment Strategist, Leveraged Finance

Jeremy H. Burton, CFA
Portfolio Manager, US High Yield and Leveraged Loans

High yield bonds are at an interesting juncture. While spreads are near historical medians, all-in yields are closer to the high end of the 20-year historical range, and bond prices and duration levels are closer to the low end. This divergence reflects several factors that have created an attractive setup for high yield investors – and as we explain, the higher rated (BB and B) portion of the market looks especially compelling.
The divergence between yield and spread owes primarily to the massive widening in Treasury yields, with the 10-year moving from 0.5% in the third quarter of 2020 to near 5% today. As the chart shows, the result is a situation where the option-adjusted spread (OAS) currently stands at 423 basis points (bps), in line with the 20-year median of 426 bps (51st percentile), but the yield to worst (YTW) is at 9.42%, well wide of the 7.24% historical median (12th percentile).
Yields on High Yield Bonds Look Compelling
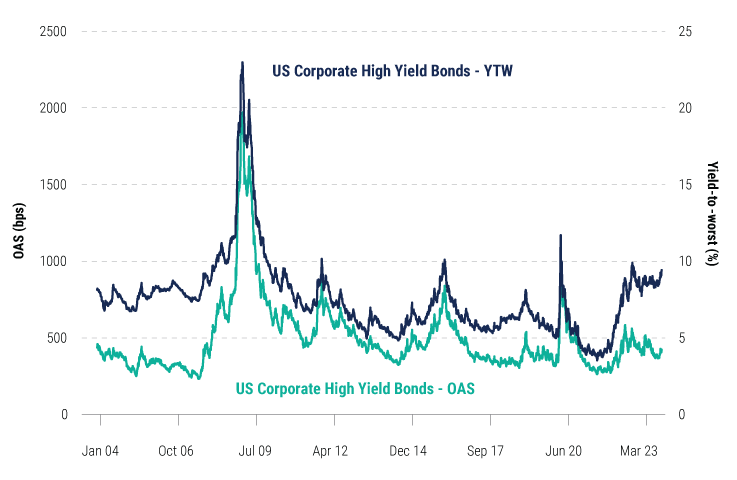
Source: Bloomberg US Corporate High Yield Bond Index as of 19 October 2023.
In addition, historically robust primary high yield issuance in the second half of 2020 and 2021, when market yields were below 5% for an extended period, has now given rise to an abundance of low-coupon but low-priced bonds − resulting in moderate coupon yields but high market yields. A weighted-average bond price of 86.19 is at the 7th percentile relative to the 20-year range. The paucity of primary issuance in 2022 and 2023 has resulted in option-adjusted duration of 3.59 years and a tenor of 4.92 years, both at or near 20-year lows. Lower duration and bond prices are key reasons why we think yields and total returns are attractive on a risk-adjusted basis. We expect a strong rolldown or “pull to par” tailwind to support the market even in a slowing economic environment.
This combination of low price, high yield, and low duration positions the high yield bond market for attractive total return potential, particularly on a risk-adjusted basis. And critically, obtaining exposure does not require compromising on credit quality. All of the comparisons to historical medians noted above are just as attractive (or more so) when excluding the CCC rated portion of the market (i.e., BB to B ratings only).
Price, Yield, Duration, and Tenor Are All at Historically Attractive Levels

Sources: Bloomberg US Corporate High Yield Bond Index and Bloomberg US Corporate Ba to B High Yield Bond Index, both as of 19 October 2023. Medians and percentiles refer to 20-year ranges.
With inflation and interest rates looking set to remain higher for longer, some deterioration in credit metrics is unavoidable. We note that the high yield bond market is starting from a point of solid corporate fundamentals. Issuers are benefiting from the extremely low fixed interest rates currently in their capital structures, but debt service will start to consume more cash flow as those positions are refinanced at market rates over the coming years. While we expect stress in the high yield market to be muted overall, it will be most acute in the lower-rated portion of the market.
Interest Coverage Is Falling, But From an All Time High
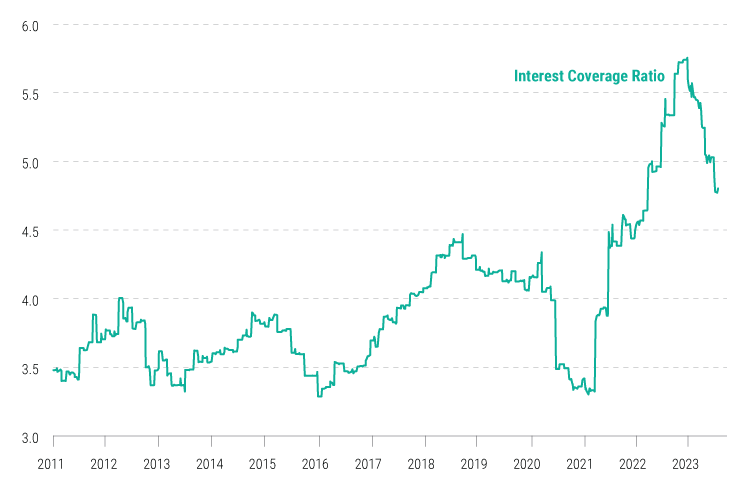
Source: BofA Global Research, High Yield Credit Chartbook, as of 30 September 2023.
What about default risk? In our view, if you avoid CCC issuers, you largely avoid that risk. Recessions clearly put significant stress on issuers, but historically, credit events and restructurings have occurred predominantly in the CCC segment. Given current macro headwinds, we prefer a slightly defensive, lower-risk stance in the context of a well-diversified portfolio. While we believe defaults will be lower than in past recessionary cycles, they will likely occur, as always, among the lower-rated issuers (see chart). We advocate a selective approach to credits rated CCC and lower. The result is that the best risk-adjusted returns are in the BB to B segment of the market (see chart). Against this backdrop, the higher quality end of high yield may provide the best of all possible worlds: historically high yields with very low potential defaults.
High Yield Default Risk Rests With Lower-Rated Issuers
US high yield issuer default rates by rating
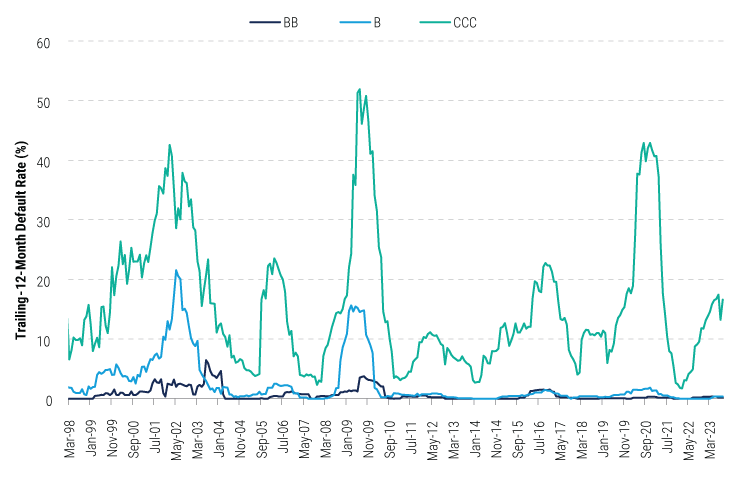
Source: BofA Global Research, High Yield Credit Chartbook, as of 30 September 2023.
The average credit quality of the high yield market has improved over time, with the BB rated segment growing as the CCC segment shrank. While this trend has abated somewhat in recent quarters, this is largely due to high levels of rising stars (upgrades to BBB from BB) versus extremely low levels of fallen angels (downgrades to BB or lower from BBB), both of which indicate strong corporate credit trends. Our view remains that overall, high yield valuations are adequately compensating for the credit risk amid moderate default expectations, and we view high yield as an attractive asset class in a diversified portfolio. We also view high yield favorably relative to other risk assets, particularly equities, where price/earnings ratios remain elevated and markets have not adjusted to the new higher-for-longer rates regime with respect to discount rates. We expect equity price volatility to persist.
BB to B Rated Issuers Make Up a Larger Share of the High Yield Bond Market
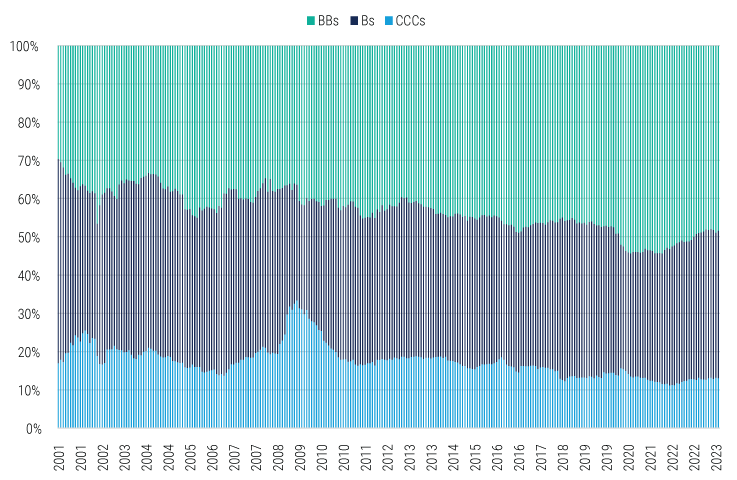
Source: BofA Global Research, High Yield Credit Chartbook, as of 30 September 2023.
Since the inception of the Bloomberg Indices in 1983, high yield has captured roughly 74% of the total return of the S&P 500 with only 55% of the risk.1 This has resulted in superior risk-adjusted returns, as measured by Sharpe ratios. Historically, the current income component of high yield bonds has offset much of the price volatility. And the mid- and higher-quality segments have historically provided even better risk-adjusted returns.
Higher-Quality High Yield Bonds Have Delivered Superior Risk-Adjusted Returns
Historical annualized returns and Sharpe ratios
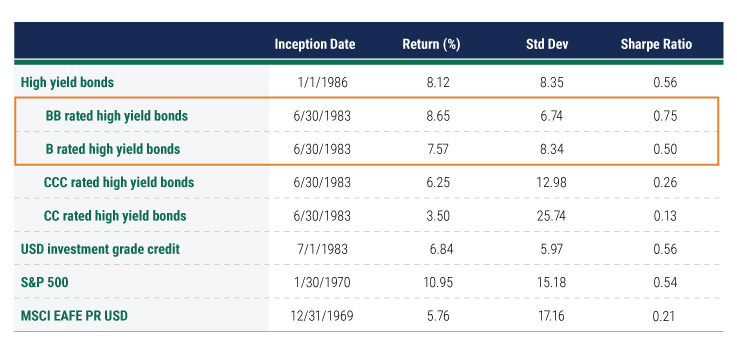
Source: Bloomberg as of 30 September 2023. High yield bonds represented by the Bloomberg US Corporate High Yield TR USD; high yield CCC rated bonds is the Bloomberg US HY Caa TR USD; high yield CC rated bonds is the Bloomberg US HY Ca To D TR USD; high yield BB rated bonds is the Bloomberg US HY Ba TR USD; high yield B rated bonds is Bloomberg US HY B TR USD; USD investment grade credit is the Bloomberg US Credit Index.
Key investor takeaways
While high yield spreads are in line with historical medians, yields are in the top quartile of the historical range, and historically low bond prices and tenors make those yields quite attractive on a risk-adjusted basis. High yield bonds rarely yield in the double-digits, and we’re now close to that level. While we acknowledge that aggressive central bank actions create a more challenging environment for issuers, we believe investors can mitigate that risk by avoiding or minimizing exposure to CCC rated bonds. Against the current macro and credit backdrop, we believe defaults will remain rare for higher-rated high yield debt. With its compelling yields, the upper portion of the high yield market – BB and B rated bonds – is a sweet spot for investors.
Footnote
1 Bloomberg as of 14 September 2022, based on returns and standard deviations of both the Bloomberg US Corporate High Yield Index and S&P 500 Index, from 1 July 1983 through 31 August 2022.
Disclosure
Investing involves risk, including possible loss of principal. The information presented herein is for illustrative purposes only and should not be considered reflective of any particular security, strategy, or investment product. It represents a general assessment of the markets at a specific time and is not a guarantee of future performance results or market movement. This material does not constitute investment, financial, legal, tax, or other advice; investment research or a product of any research department; an offer to sell, or the solicitation of an offer to purchase any security or interest in a fund; or a recommendation for any investment product or strategy. PineBridge Investments is not soliciting or recommending any action based on information in this document. Any opinions, projections, or forward-looking statements expressed herein are solely those of the author, may differ from the views or opinions expressed by other areas of PineBridge Investments, and are only for general informational purposes as of the date indicated. Views may be based on third-party data that has not been independently verified. PineBridge Investments does not approve of or endorse any republication of this material. You are solely responsible for deciding whether any investment product or strategy is appropriate for you based upon your investment goals, financial situation and tolerance for risk.

