High Yield Bonds: How Price Discounts to Par Can Benefit Investors

Andrew Karlsberg, CFA
Portfolio Risk Manager and Investment Strategist, Leveraged Finance

High yield bonds offer a key benefit that many investors may be overlooking in today’s market: a discount in terms of the average price relative to par.
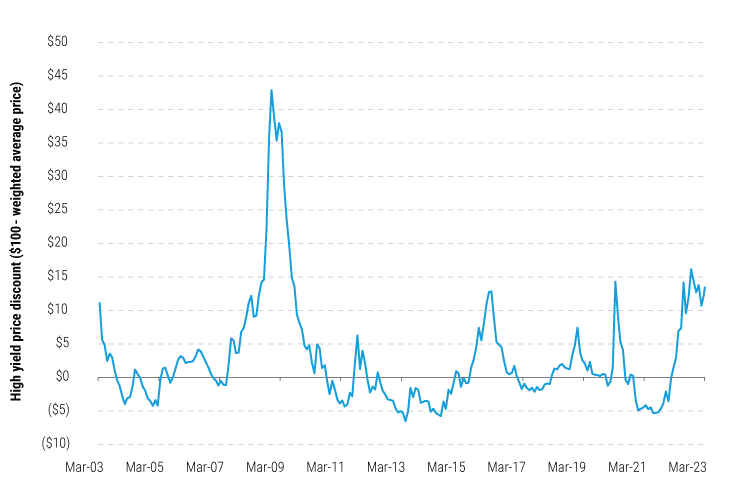
Historically, when high yield spreads have been near longer-term averages in the range of 400-600 basis points (as they are currently), the weighted average price for the asset class has not offered a significant discount to par. However, due to the sharp increase in US Treasury rates in 2022, the weighted average price for the Bloomberg High Yield Index is currently at a significant discount, at $88.56, while spreads are closer to longer-term averages at 466 basis points.1
When investors forecast high yield total returns, they often consider the expected loss given default. Assuming a longer-term average recovery on defaulted securities of $40 and a default rate by par amount of 4%, this additional $11.50 discount in price indicates an additional 46 basis points of annual total return due to the lower expected loss given default (see chart). During past periods when the weighted average price for the high yield market offered a significant discount to par – e.g., at the end of 2008 and early 2009, in February 2016, and in March of 2020 – we have seen attractive entry points to add to the asset class.
Bottom line? High yield bonds’ price discount relative to par means selective investors may find compelling entry points in today’s market.
High Yield’s Price Discounts Offer an Attractive Entry Point

Source: Bloomberg, based on the Bloomberg US Corporate High Yield Bond Index, as of 31 March 2023.
Footnotes
1 Source: Bloomberg, based on the Bloomberg US Corporate High Yield Bond Index, as of 31 March 2023.
Disclosure
Investing involves risk, including possible loss of principal. The information presented herein is for illustrative purposes only and should not be considered reflective of any particular security, strategy, or investment product. It represents a general assessment of the markets at a specific time and is not a guarantee of future performance results or market movement. This material does not constitute investment, financial, legal, tax, or other advice; investment research or a product of any research department; an offer to sell, or the solicitation of an offer to purchase any security or interest in a fund; or a recommendation for any investment product or strategy. PineBridge Investments is not soliciting or recommending any action based on information in this document. Any opinions, projections, or forward-looking statements expressed herein are solely those of the author, may differ from the views or opinions expressed by other areas of PineBridge Investments, and are only for general informational purposes as of the date indicated. Views may be based on third-party data that has not been independently verified. PineBridge Investments does not approve of or endorse any republication of this material. You are solely responsible for deciding whether any investment product or strategy is appropriate for you based upon your investment goals, financial situation and tolerance for risk.


