2024 Multi-Asset Outlook: Rates Lead the Way

Michael J. Kelly, CFA
Global Head of Multi-Asset
Treasuries appear to be the first asset class to have shaken off the free-money era, with real yields across the entire curve – hovering near 2.5% – restored not only to pre-financial-crisis levels but nearly back to the levels seen before China entered the WTO in 2001.
In fixed income, long US Treasuries look enticing, and Asia’s high yield market presents opportunities in shorter-duration, higher-spread investments (away from China’s property markets). We also like local currency debt from Chile and Brazil, which have initiated the current global policy easing cycle.
Select EM equities, notably a secular opportunity in India and a cyclical one in China, could benefit from enduring growth momentum. Meanwhile, developed market fundamentals are slowing and liquidity is draining, and DM stocks generally look overvalued. That said, we see opportunity in health care and Japanese banks.
Gold is one of the few assets that benefit from uncertainty and shocks to the system, and with rising geopolitical risks driving alternatives, gold is back.

The sleeping giant of suppressed rates has awoken after a dozen-year nap. As prescient as ever, Treasuries now appear to be the first asset class to have shaken off the free-money era, with real yields across the entire curve – hovering near 2.5% – restored not only to pre-financial-crisis levels but nearly back to the levels seen before China entered the World Trade Organization (WTO) in 2001. After this, the West outsourced much of its capital intensity to China, changing its savings vs. investment balance in favor of lower real rates. If the rates curve is now appropriately priced, it’s unlikely that other asset classes can be – yet. This is what 2024 must decipher. We believe rates have this right.
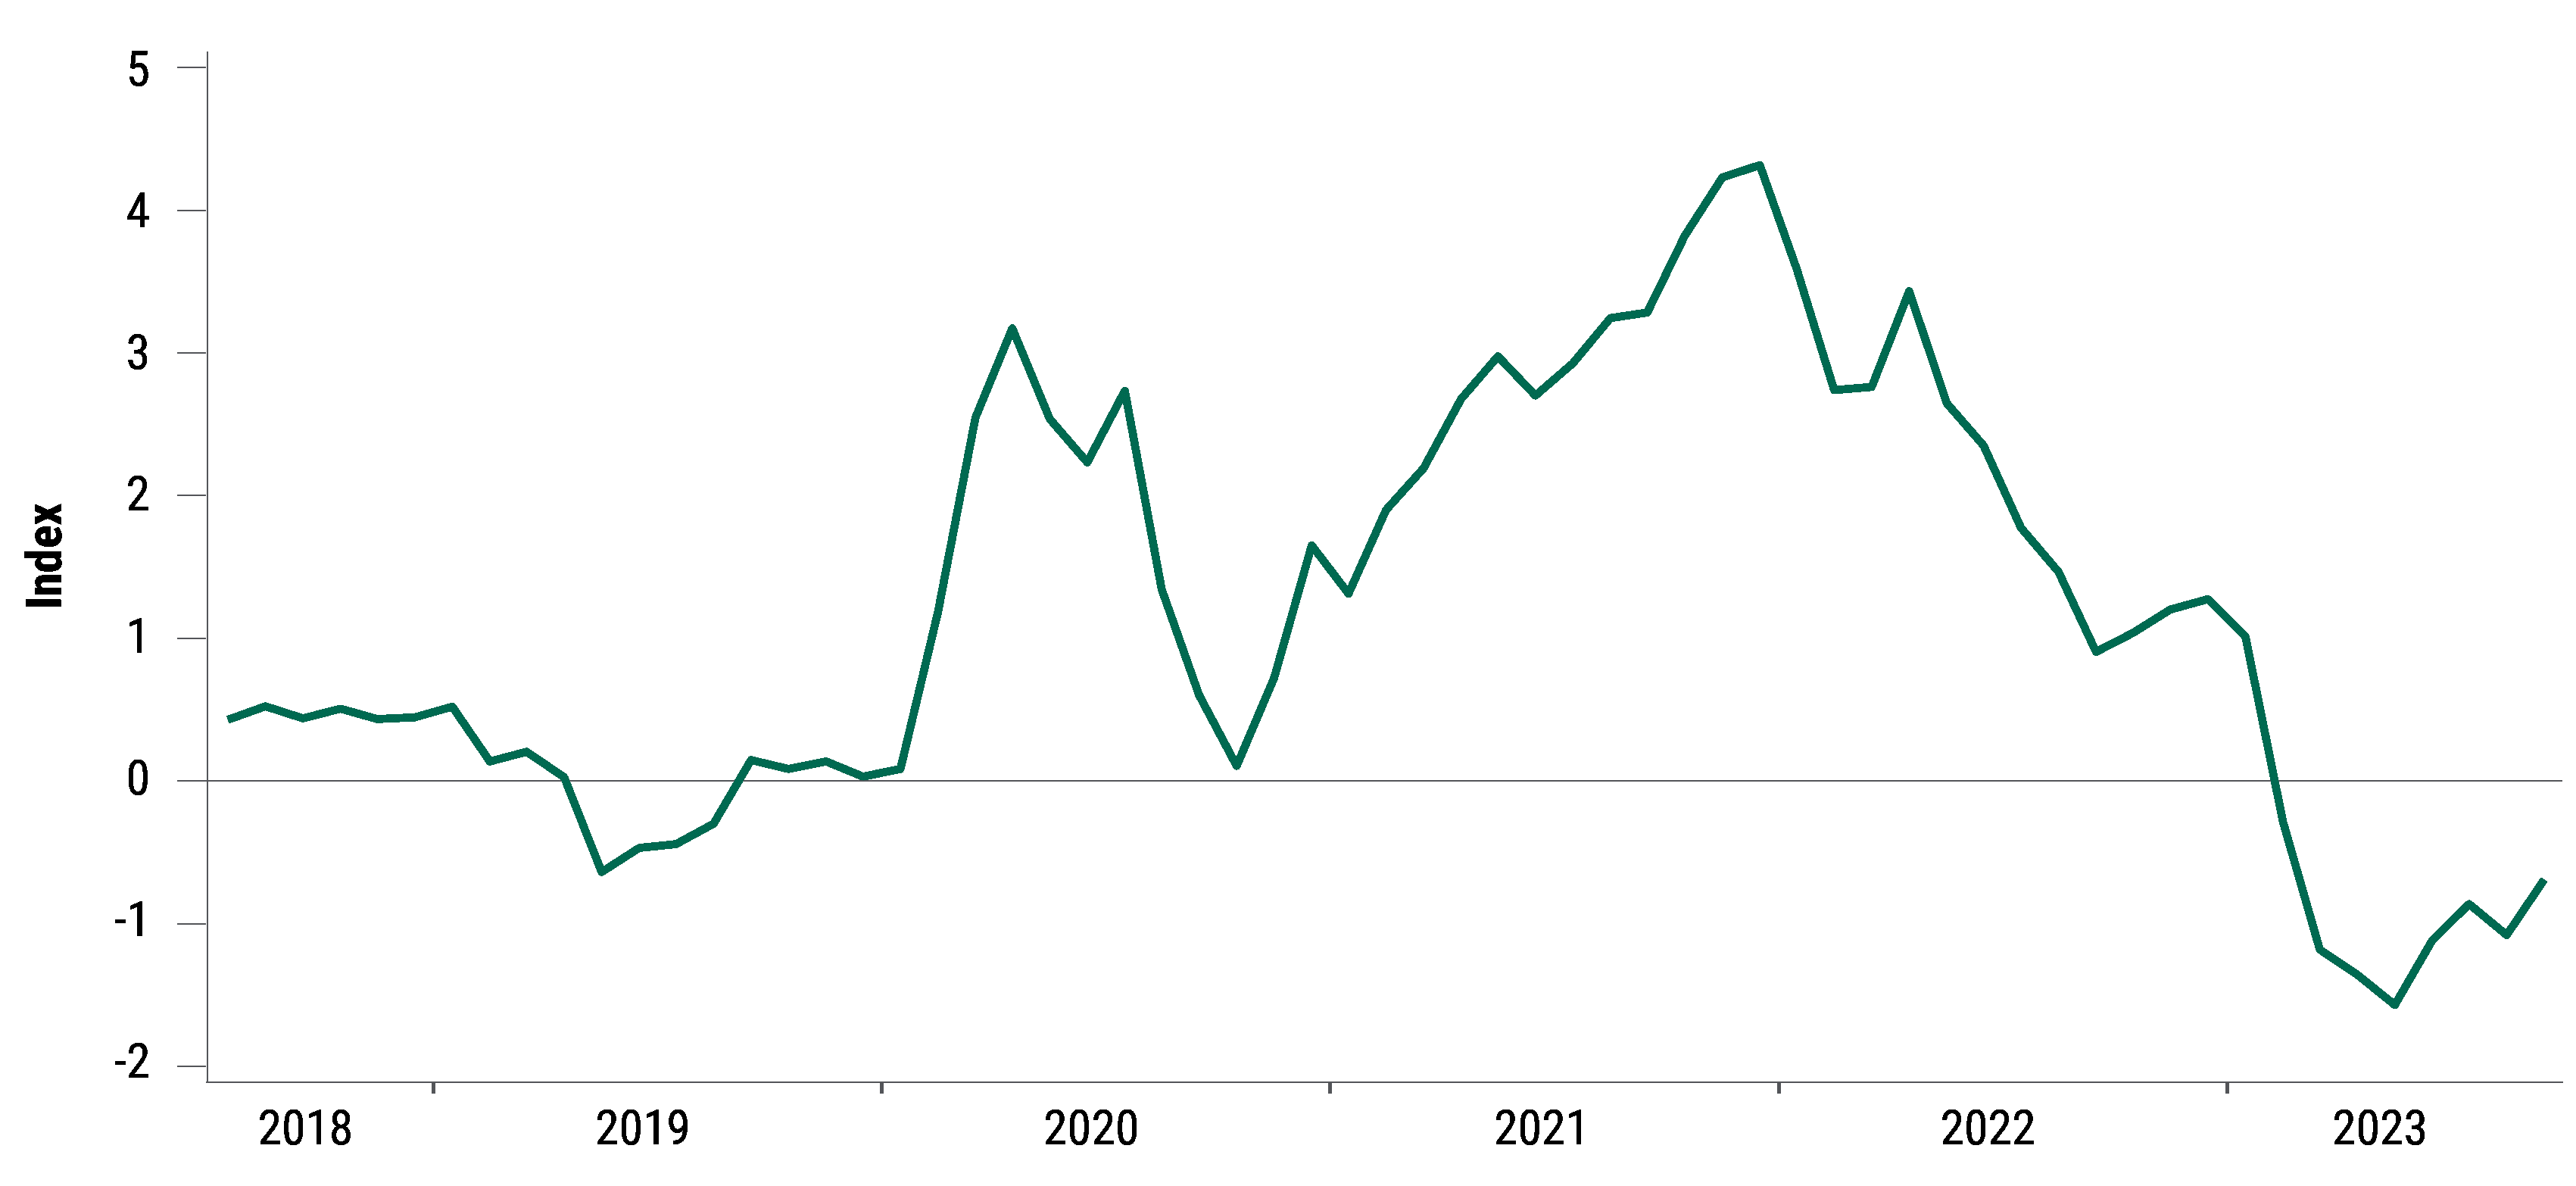
As we head into 2024, two key issues are likely to surface. First, the rapid supply-side-driven disinflation and productivity kickers we’ve seen likely resulted from the clearing of Covid disruptions to supply chains. This manifested in a third-quarter overshoot of disinflation to the downside and productivity to the upside. We don’t expect those trends to continue, particularly with the global supply-chain pressure index already backing up (see chart), and thus core inflation likely to perk up again, as it began to do in October.
Supply-Chain Pressures Have Started to Tick Up Again
Federal Reserve Global Supply Chain Pressure Index

Source: Bloomberg, Macrobond, Fed Global Supply Chain Pressure Index as of 30 September 2023.
Second, on the demand side, a mysterious “stealth” fiscal thrust appeared in the US in 2023 (to the tune of 4% of GDP) as prior 10-year spending authorizations kicked in during the first three quarters, adding a surge of demand and a material source of economic resilience. This too looks to have peaked in the third quarter, with growth coming off the boil quite quickly now – and the “last mile” of disinflation may be a long way off, absent a recession.
Those favorable, overlapping, unexpected, yet apparently short-lived bursts of supply and demand now look to be behind us. If inflation does prove sticky from here, cuts to policy rates in 2024 will need to be limited to only those that keep real interest rates from rising further. Such modest relief – when combined with the second ongoing restrictive monetary lever, quantitative tightening (QT) – appear to be setting the stage for another year of net liquidity drainage in the West (again, absent a recession). This could well magnify the cracks already spreading in the West’s economic and market foundation. As 2023’s stealth fiscal thrust dissipates, we expect private sector weakness to seep through. These forces, together with ongoing liquidity drainage, appear likely to widen credit spreads as well as equity and illiquidity risk premia.
Meanwhile, although green shoots did appear in China, it took a bit of a relapse for policymakers to show their resolve. The new economic pragmatism we’ve observed since November 2022 continues to shine through. A moderate cyclical recovery appears likely to carry China past the next two to three years, during which the country will be reengineering its property sector via Article 14 of its property code, which will once again welcome higher-end housing construction, but with a mechanism whereby such construction subsidizes affordable lower-end housing.
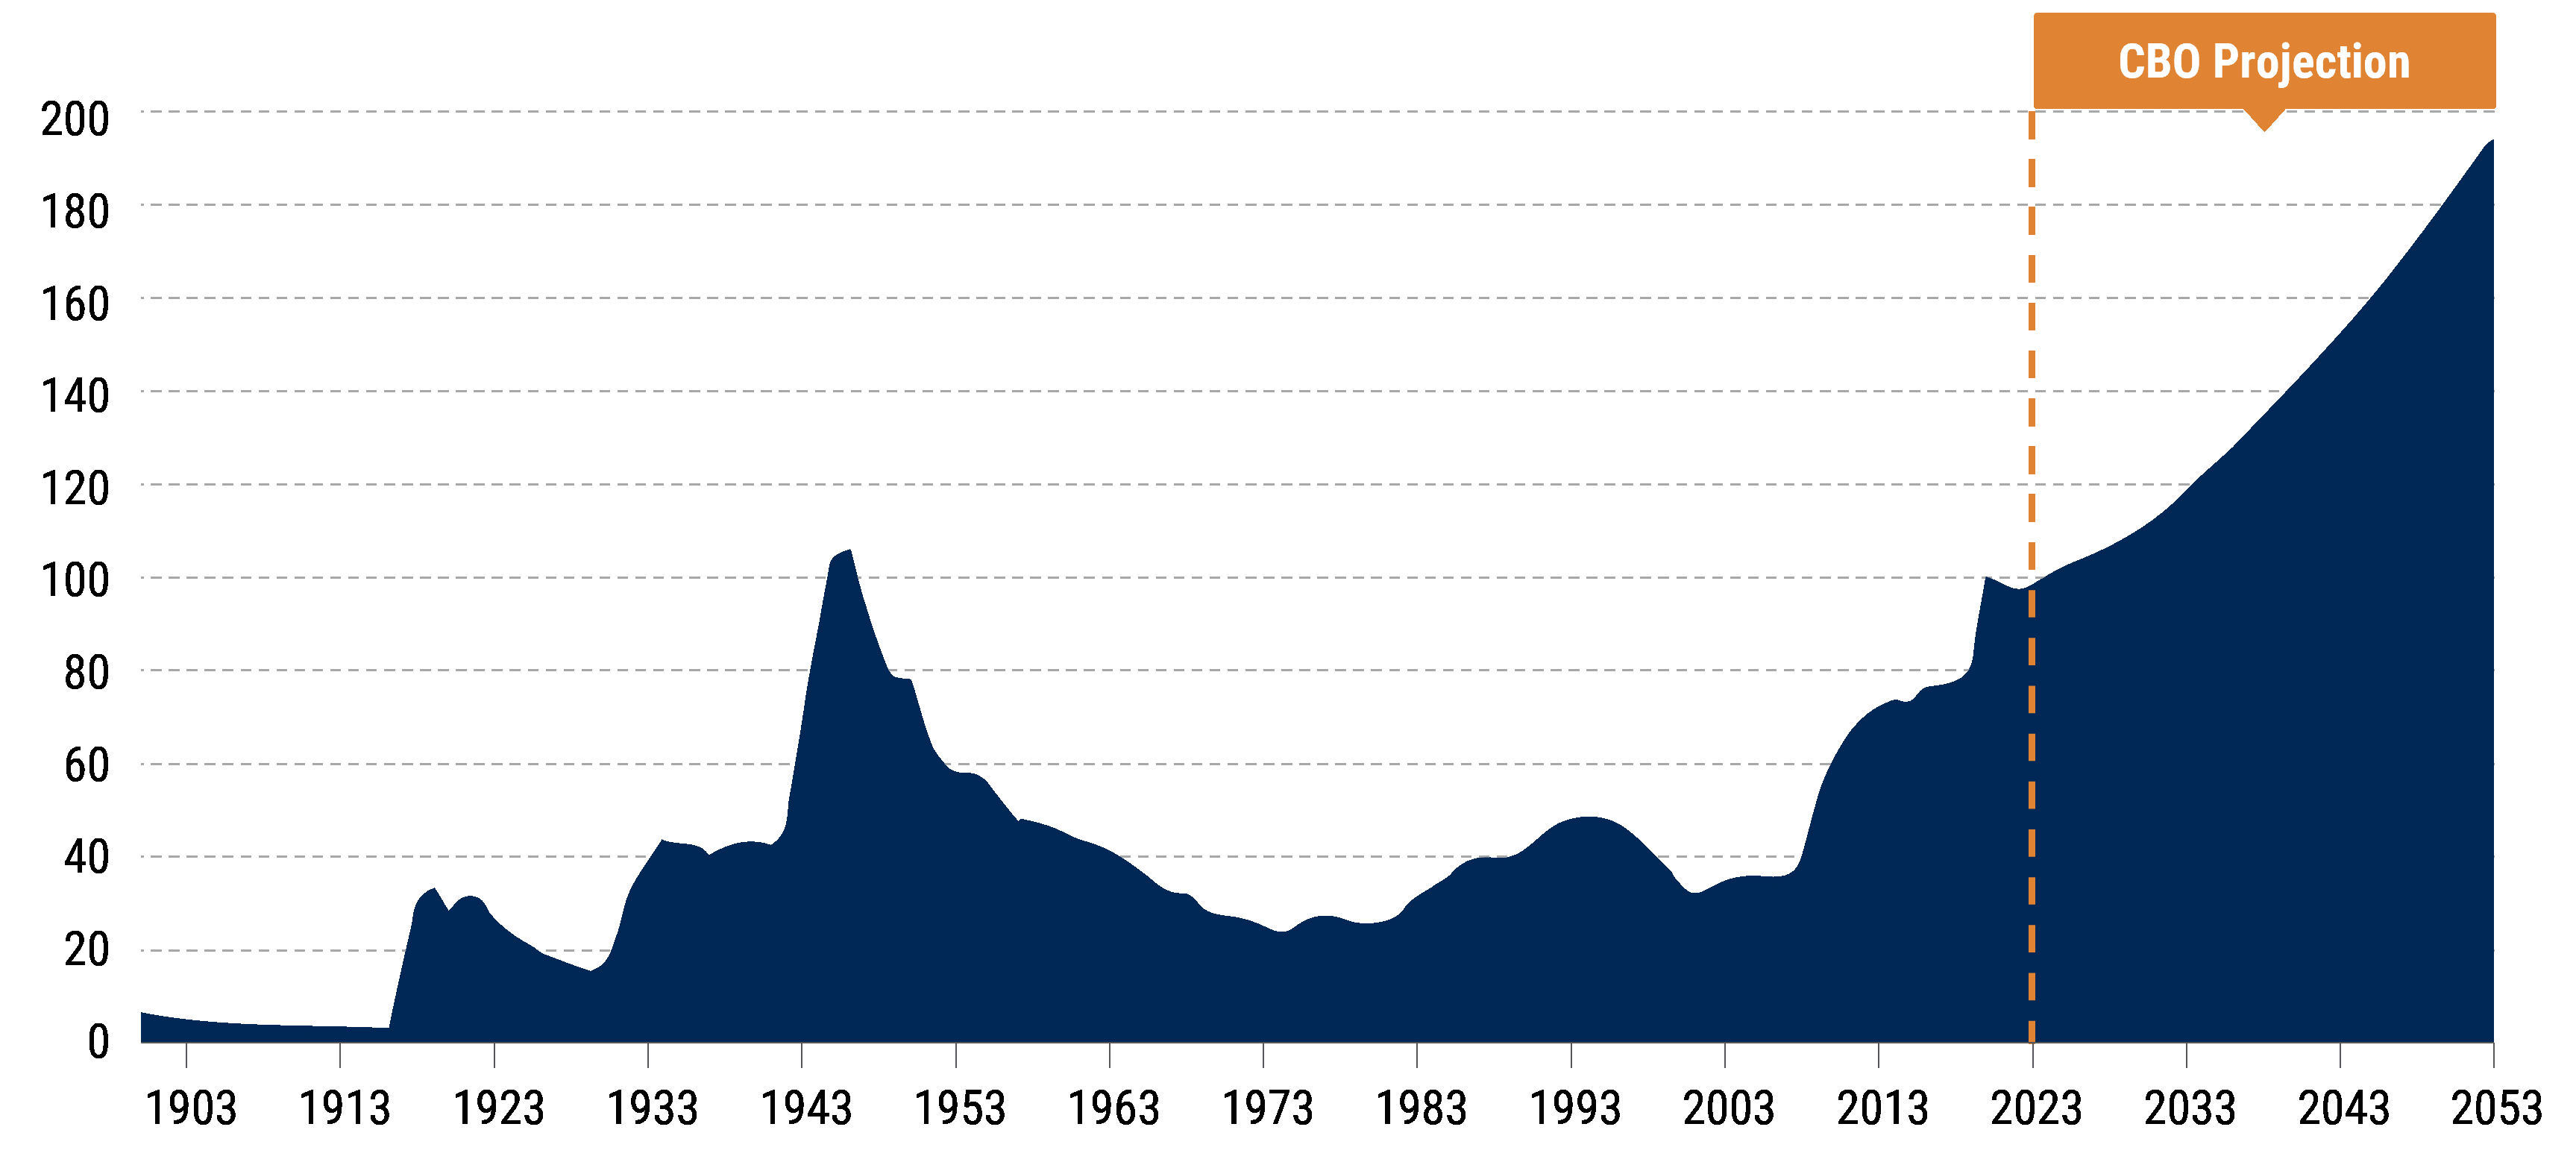
The ongoing de-dollarization we’ve observed also looks poised to continue, with China promoting the yuan as a widely used currency for trade among the Global South. This trend, along with US policy rates bending down gently in the back half of 2024, sets the stage for a declining dollar and a rotation to non-US assets. All things considered, we are entering 2024 with a cautious stance. US government finances are showing strain, even before the country begins to finance a second proxy war (see chart). Real rates are now at levels that historically have restrained growth, a point at which risk premia rise, catching up to the prescient Treasury curve.
US Debt/GDP Is on an Unsustainable Trajectory
CBO projection of federal debt/GDP 1

1Represents US Treasury Debt held by the public, removing central bank holdings of Treasuries and leaving only economically driven owners of Treasuries. Source: The Congressional Budget Office's Budget and Economic Outlook: 2023 to 2033. February 2023. https://www.cbo.gov/publication/58946
Here we share our top multi-asset investment convictions for 2024.
Key Convictions
1. In fixed income, we see compelling opportunities in long US Treasuries and select EM debt.
US real yields have reverted not only to pre-financial-crisis norms, but near to the 2.5% levels last seen before China entered the WTO in late-2001 – an event that spurred outsourcing of capital intensity to China. During that period, when cyclical growth pushed real interest rates beyond 2.5%, markets came to understand that slowing growth – and with that, rising risks – lay ahead, thus widening risk premia. We enter 2024 flirting with these levels. This makes long-duration Treasuries very enticing, since further backups in real rates are now likely to quickly become self-correcting. Without the “stealth” fiscal thrust of 2023, if growth slows quickly, longer Treasuries may bear even more fruit.
Asia’s high yield market presents opportunities in shorter-duration, higher-spread investments – though investors must take a half step away from China’s property markets. In India, independent power producers are addressing a structural power shortage with high yield bonds. Another example is Macau, where the approval of more flights from China and an influx of Chinese tourists are creating a better revenue profile ahead to secure the finances of these high yield bonds.
Meanwhile, Chile and Brazil initiated the current global policy easing cycle this time around, and we currently like their local currency debt.
2. Select EM equities, notably in India, could benefit from enduring growth momentum, while developed market stocks look overvalued – though pockets of opportunity remain.
We view valuations in emerging market equities as attractive, with support from economic acceleration and no need to offset policy rate reductions with QT drainage. We remain optimistic about Indian equities, given increasing foreign direct investment driven by Prime Minister Modi’s policies. India increasingly looks like a secular opportunity, with its growing labor force and more-robust banking system also contributing to a rising credit and investment cycle. Meanwhile, the rate cuts in Chile and Brazil have sounded the bell on an EM-led global easing cycle that has left developed markets far behind – reinforcing our tilt toward emerging markets. China’s equity market also looks promising as a cyclical recovery prospect.
DM valuations are less attractive on the whole, given tightening credit conditions and a top-of-the-cycle fiscal thrust that’s nudging central banks to hold policy rates higher for longer, along with ongoing QT. Yet some sectors still shine through.
Health care is attractive on its own merits. It should continue to benefit from the resurgence of discretionary procedures and other care after long delays, which creates a more profitable mix as well as incremental volume. The long-feared impact of the Inflation Reduction Act on drug pricing, which was largely responsible for the sector’s underperformance in 2023, has turned out to be somewhat of a paper tiger.
We also favor Japanese banks, which we believe are the prime beneficiaries of the turnabout after three decades of interest rate suppression. The Tokyo Stock Exchange’s new reforms also target companies with price/book ratios below 1.0, requiring them to develop plans to improve their return on equity. The banks are a low price/book industry in Japan.
3. With rising geopolitical risks driving alternatives, gold is back.
Gold is one of the few assets that benefit from uncertainty and shocks to the system. At present, Russia appears to be helping North Korea to improve its nuclear capabilities. Europe and the Middle East are in the midst of what could be drawn-out proxy wars, with the potential to heat up. The US and China, the world’s two largest economies, have incurred escalating economic and military tensions. Never have we seen so many black swans flying our way. Gold has also performed better than one would expect given the fundamentals that unfolded over the last two years. We attribute a 5% tailwind to gold (separate from its usual drivers) from the de-dollarization program in the Global South, where some central banks are using their Treasury proceeds to acquire gold.
For more investing insights, access our 2024 Global Investment Outlook.
Disclosure
Investing involves risk, including possible loss of principal. The information presented herein is for illustrative purposes only and should not be considered reflective of any particular security, strategy, or investment product. It represents a general assessment of the markets at a specific time and is not a guarantee of future performance results or market movement. This material does not constitute investment, financial, legal, tax, or other advice; investment research or a product of any research department; an offer to sell, or the solicitation of an offer to purchase any security or interest in a fund; or a recommendation for any investment product or strategy. PineBridge Investments is not soliciting or recommending any action based on information in this document. Any opinions, projections, or forward-looking statements expressed herein are solely those of the author, may differ from the views or opinions expressed by other areas of PineBridge Investments, and are only for general informational purposes as of the date indicated. Views may be based on third-party data that has not been independently verified. PineBridge Investments does not approve of or endorse any republication of this material. You are solely responsible for deciding whether any investment product or strategy is appropriate for you based upon your investment goals, financial situation and tolerance for risk.


